COD & RTO in Indian D2C: The 2026 Benchmark Report
RTO rate India ecommerce 2026: COD vs prepaid return benchmarks, RTO by category, and how each verification method changes RTO for Shopify D2C.
Quick verdict
India's ecommerce RTO rate spiked to nearly 39% during the November 2025 festive season and fell back to around 21% by February 2026 among improved brands.
That's based on Unicommerce/Shipway data across 410 million-plus shipments and 6,000-plus brands.
The gap between those two numbers comes down to three things Unicommerce itself names:
- Address verification before dispatch
- Prepaid incentives
- Pincode-level courier selection
None of that is a TopEdge claim. It's what the country's largest ecommerce operations platform reports about its own network.
Most RTO rate figures quoted for India ecommerce are one brand's anecdote or a logistics pitch deck. This report is built on one large, attributable dataset and names the gaps where no credible number exists.
How this benchmark was built
This report is built around one verified, large-scale data point, Unicommerce/Shipway's RTO data across 410M+ shipments and 6,000+ brands, corroborated by independent trade press (Apparel Resources) and Unicommerce's own investor newsletter. Where other public sources exist but come from companies selling competing WhatsApp/COD-automation products, we've left their specific numbers out rather than repeat unverified vendor marketing claims as fact.
What Unicommerce's data shows
Short answer: the RTO rate in India ecommerce depends heavily on payment method and on whether you verify orders before dispatch. Here is the national picture from the one dataset we could verify.
| Metric | Figure | Source |
|---|---|---|
| National RTO, festive season (Nov 2025) | ~39% | Unicommerce/Shipway, via Apparel Resources + Unicommerce Apr 2026 newsletter |
| RTO among improved brands (Feb 2026) | ~21% | Same source |
| Sample size | 410M+ shipments, 6,000+ brands | Same source |
Unicommerce attributes the gap to three levers: stronger order verification before dispatch, better prepaid incentives, and smarter courier selection by pincode, not a single silver bullet.
Use the national average as a sanity check, not a budget line. Blended RTO hides wide spread by pincode, courier partner, and order value. Two brands with the same average can have completely different problem pincodes. And because your COD share alone shifts your blended figure, compare COD to COD and prepaid to prepaid.
RTO benchmark by category
Fashion, lifestyle, and other impulse-purchase categories consistently show the highest COD RTO, driven by size/fit uncertainty and low-commitment ordering, but we didn't find a single authoritative published breakdown by category. Treat category-level RTO with caution until you have your own segment data.
RTO by verification method
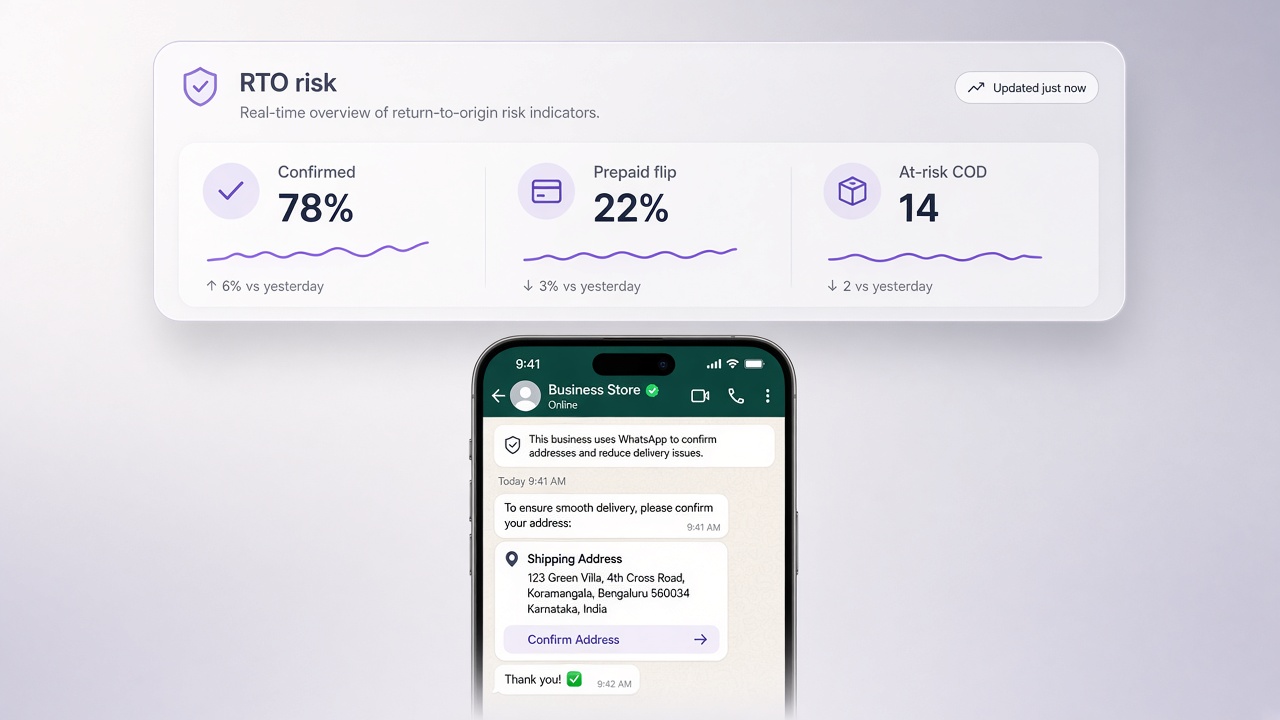
Some WhatsApp automation vendors publish tiered RTO figures by verification method: no verification, manual calling, automated confirmation, AI risk scoring. We looked at several; none were independently verifiable, so we're not repeating specific percentages here. What Unicommerce's own data supports is directional: address verification before dispatch is one of the three named levers separating 39% from 21%.
What is actually driving returns
Most COD returns trace back to impulse or fake orders, unreachable buyers, bad addresses, and delivery slow enough for intent to cool. For the full picture, read our breakdown of why RTO spikes on COD.
The fix, in brief
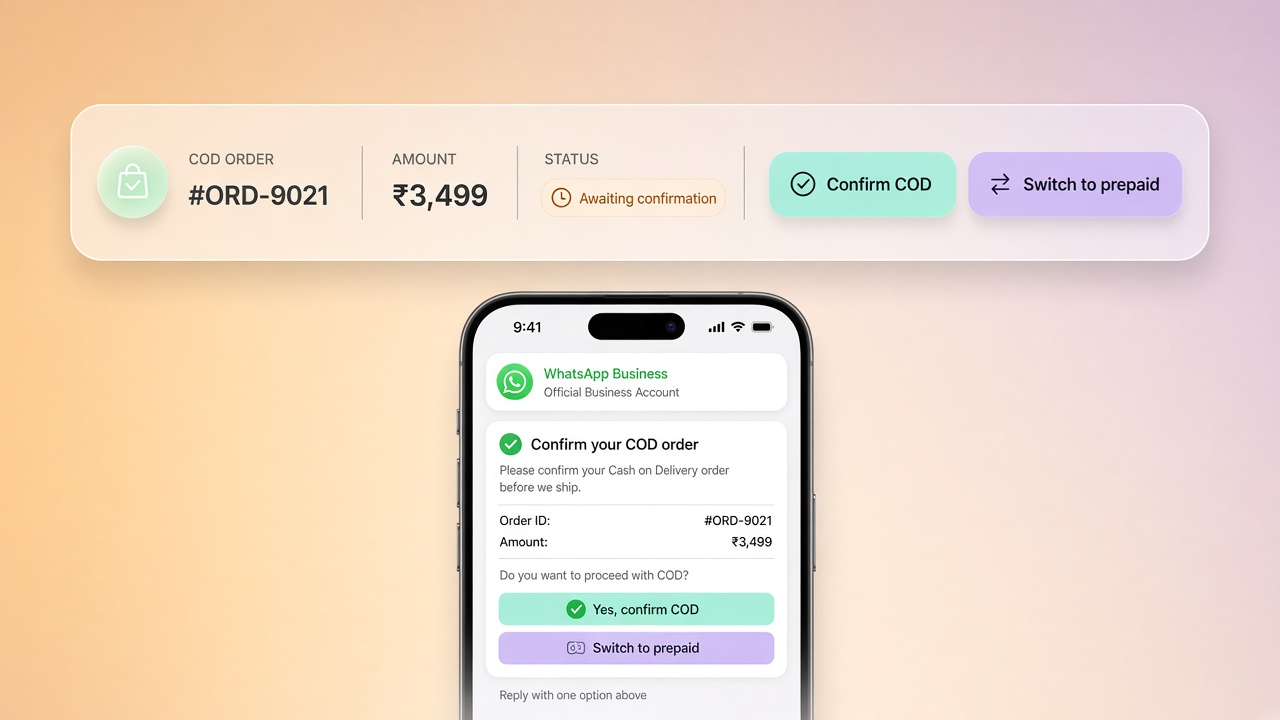
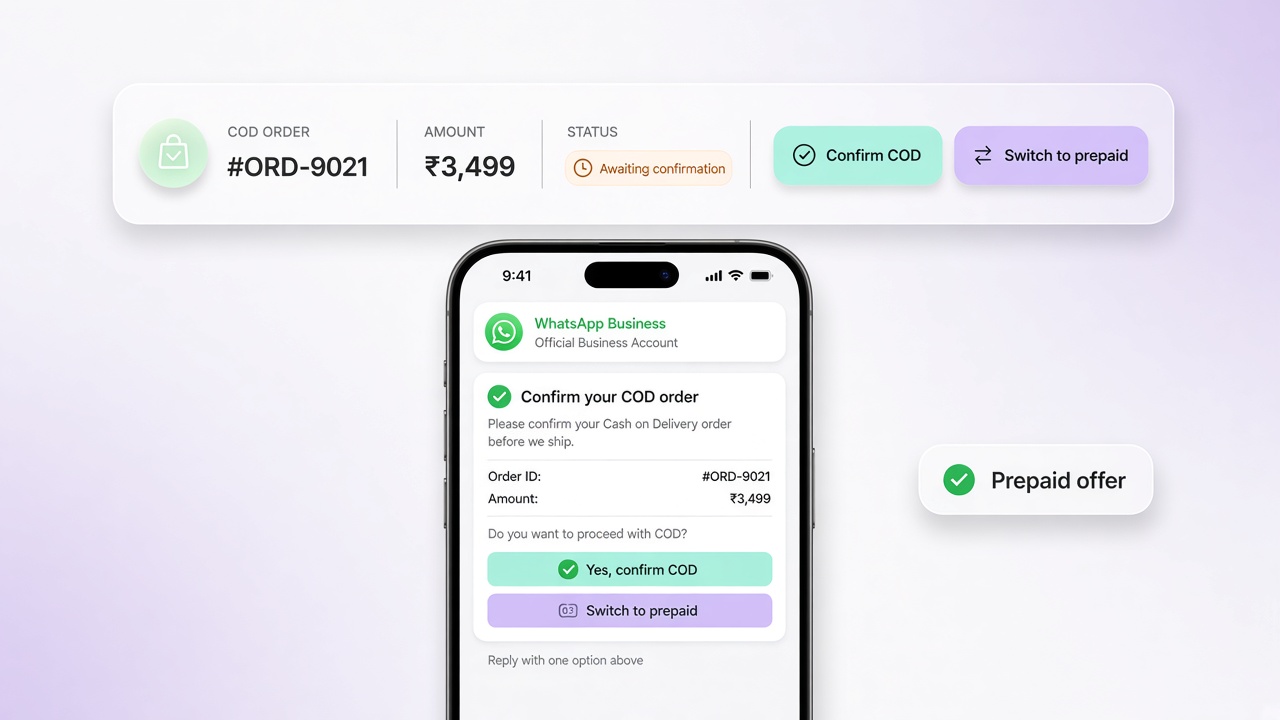
Confirm intent before pick and pack. Send one approved WhatsApp utility template with the order number and ₹ total, branch on confirm / reschedule / cancel, send one reminder, then apply a written hold-or-cancel policy. The cost is friction: some genuine buyers will never reply, and your policy decides whether you lose them or ship the risk.
The direct cost is Meta's per-message fee for each utility template, plus your WhatsApp platform's plan. Meta's current India rates are in our WhatsApp Business API pricing guide for India.
The setup detail lives in two playbooks: WhatsApp COD confirmation setup for Shopify and the step-by-step RTO reduction playbook. Build the flow with COD confirmation journeys, then measure your own RTO % against the benchmarks above.
Common questions
What is a good RTO rate for an Indian D2C brand?
Unicommerce/Shipway data shows brands that improved verification and courier selection at around 21% RTO in February 2026, against roughly 39% across the network at the November 2025 festive peak (410M+ shipments, 6,000+ brands). Getting close to that 21% mark puts you ahead of most of the market.
What is the average RTO percentage for COD orders in India?
Unicommerce/Shipway data puts national RTO at roughly 39% during festive peak (Nov 2025), falling to around 21% among brands that verify orders and optimize courier selection (Feb 2026).
Why is RTO higher for COD than prepaid?
COD removes the commitment a payment creates. Buyers can order on impulse and simply decline delivery, where a prepaid order has already cleared a real purchase-intent filter.
Which ecommerce categories have the highest RTO in India?
Fashion and lifestyle categories are widely reported as the highest-RTO segments due to size/fit issues and impulse ordering, though no single published source breaks this out with reliable category-level percentages. Treat category claims with caution.
Does WhatsApp COD confirmation actually reduce RTO?
Unicommerce names order verification before dispatch as one of the three levers separating top-performing brands from the rest. WhatsApp is a practical, high-response channel for that verification, but we haven't found independently verified data isolating WhatsApp's effect on its own versus other verification channels.
Should I turn off COD to cut RTO?
Usually not outright. Removing COD can cut RTO while also cutting orders, and the net effect depends on your margin and how many buyers will pay upfront. Test it on one high-RTO segment or pincode group first, and judge it on contribution margin, not RTO alone.
The 2026 India ecommerce RTO rate figures in this report come from Unicommerce/Shipway data across 410M+ shipments and 6,000+ brands, as reported by Apparel Resources and in Unicommerce’s April 2026 investor newsletter. They are not TopEdge merchant data. The ~39% figure is the November 2025 festive peak across the network; the ~21% figure is improved brands in February 2026: different months and different cohorts, so read the gap as directional, not as a controlled before-and-after. Neither is a forecast or guarantee for your store.
RTO is one line in a bigger P&L. To see where it sits against product cost, shipping, acquisition cost and platform fees, work through how to run a profitable ecommerce business in India, which breaks down realistic net margins by category.
Benchmark yourself, then act: set up COD confirmation journeys, measure your own RTO % in Profit & costs, compare plans on TopEdge pricing, or start free on your Shopify store.